Build and validate a strategy in QUANTHEON Lab: a full walkthrough
From a plain-English idea to a stress-tested verdict — no code. Four phases, real screenshots of the live app, and the rules that decide what your numbers mean. Worked on a classic EMA trend-follower on Microsoft, over twenty-one years — a deliberately ordinary example, and the numbers below are the ones it really produces.
The map
- 1 · Design — two views of one strategy: Canvas (the block graph) and Chart (the same rules drawn on price, with the real trade markers).
- 2 · Review — the backtest against its benchmark, and beneath it the Overfitting Polygraph: walk-forward, Monte-Carlo, parameter stability, one verdict.
- 3 · Optimize — search the parameters, with the out-of-sample half kept back as a gate.
- 4 · Evolve — breed and mutate variants when tuning has run out.
- The desk, on the left throughout: describe it, change it, ask it why.
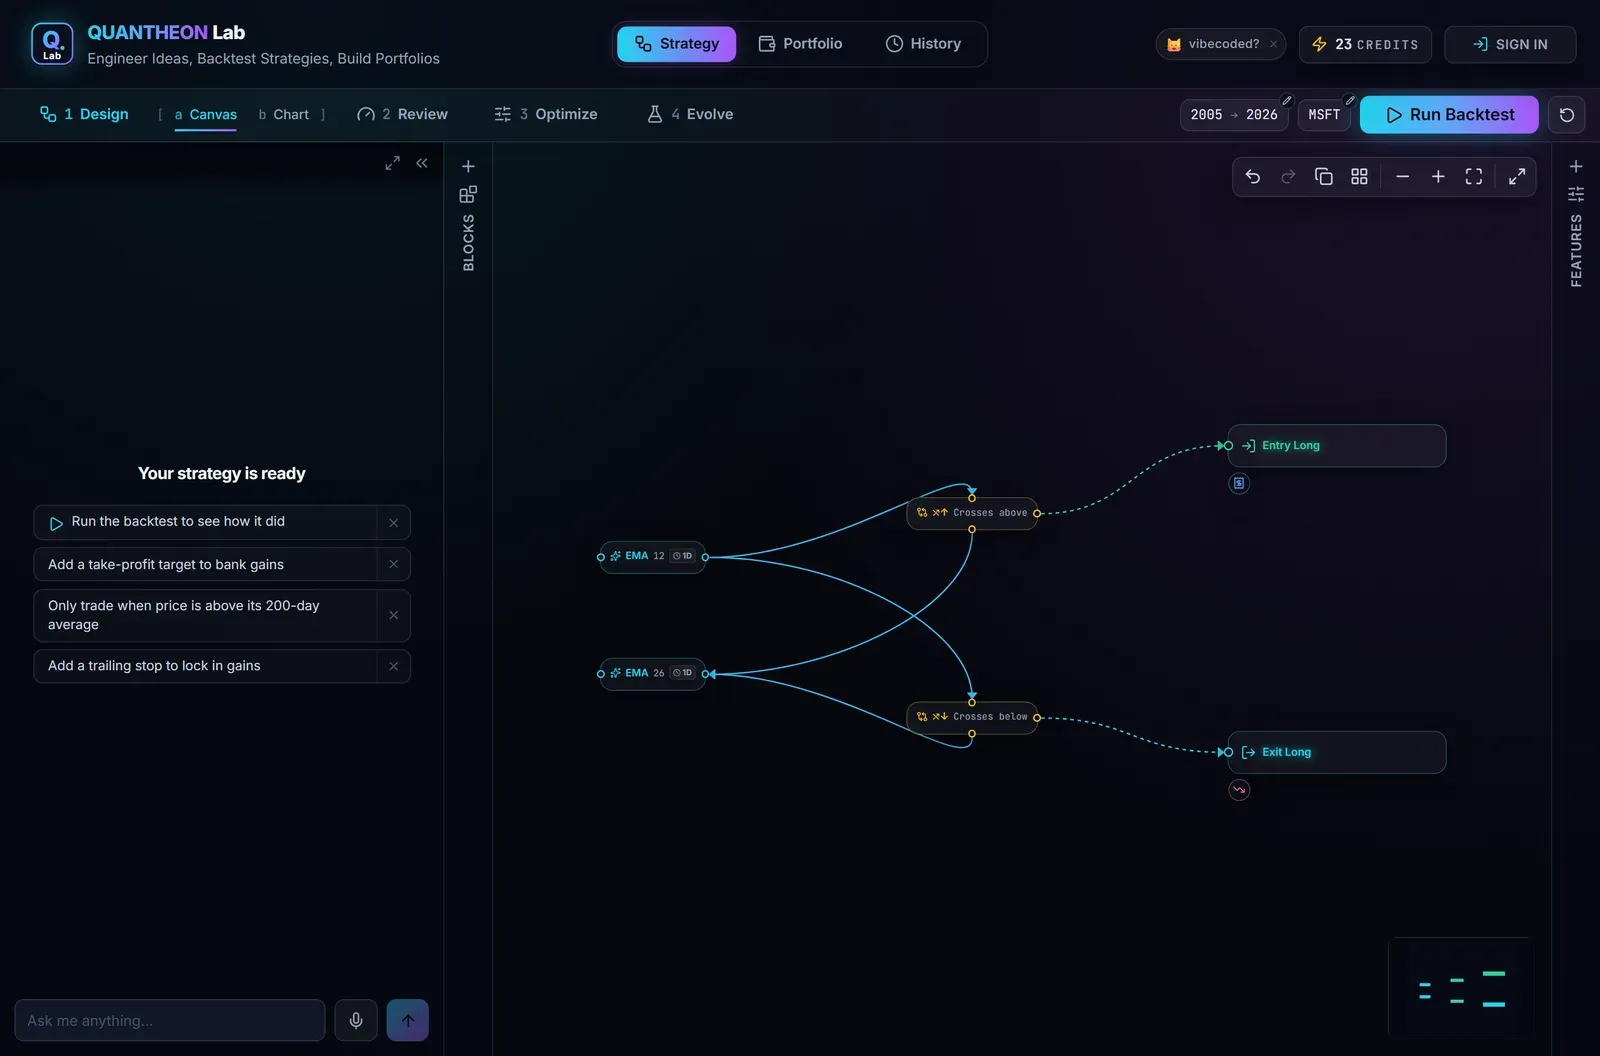
A research desk on the left, a live strategy on the right.
1 · Design
There is no setup form to fill in. You start by talking — describe the idea, load a vetted preset, or wire the blocks by hand — and the name and the instrument come with it, editable from the bar at the top whenever you want them different. Everything that changes what the engine does — instrument, timeframe, window, capital, stops, targets, sizing, costs — lives in the Features panel on the right, one switch per idea.
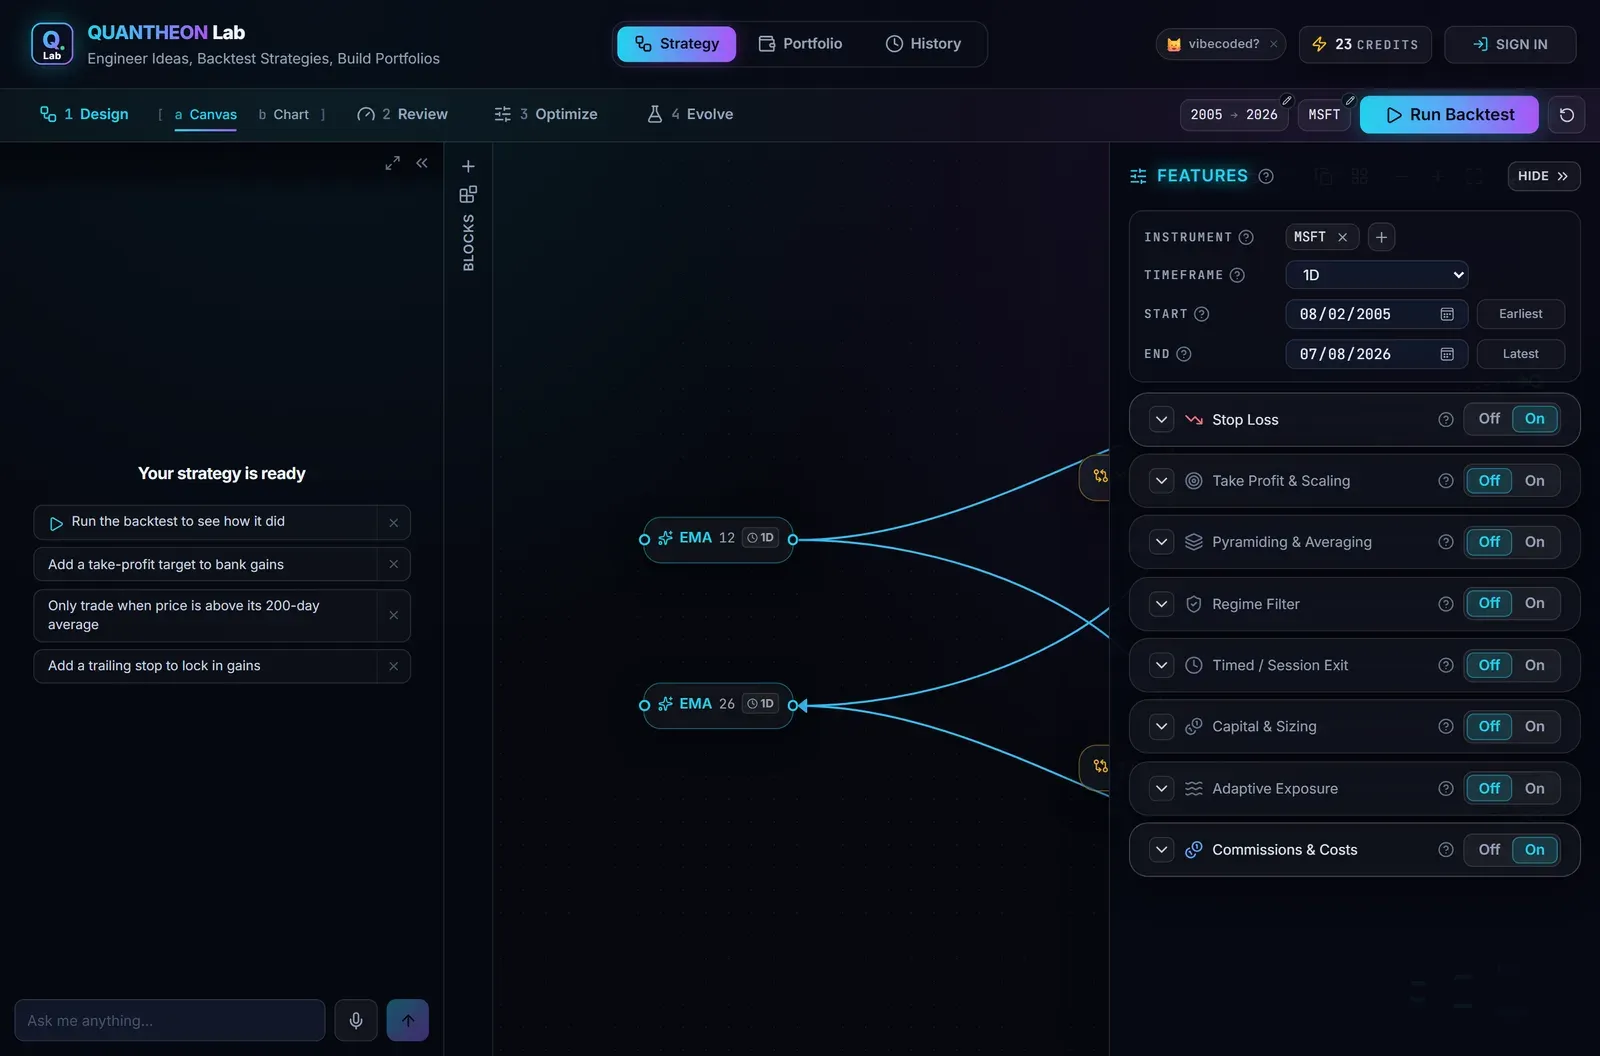
The desk proposes the next move — and every switch that changes the engine is one panel away.
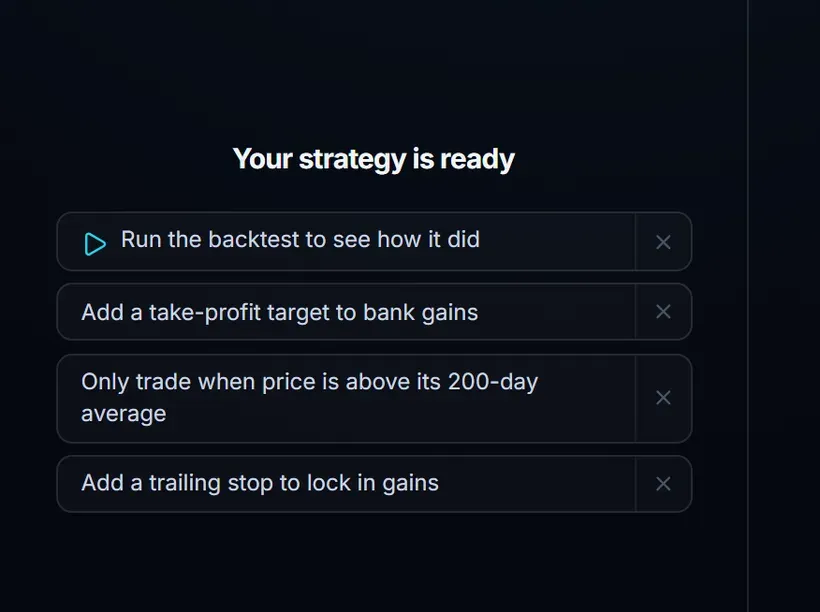
It builds, changes and explains — and offers the sharpest next move as one click.
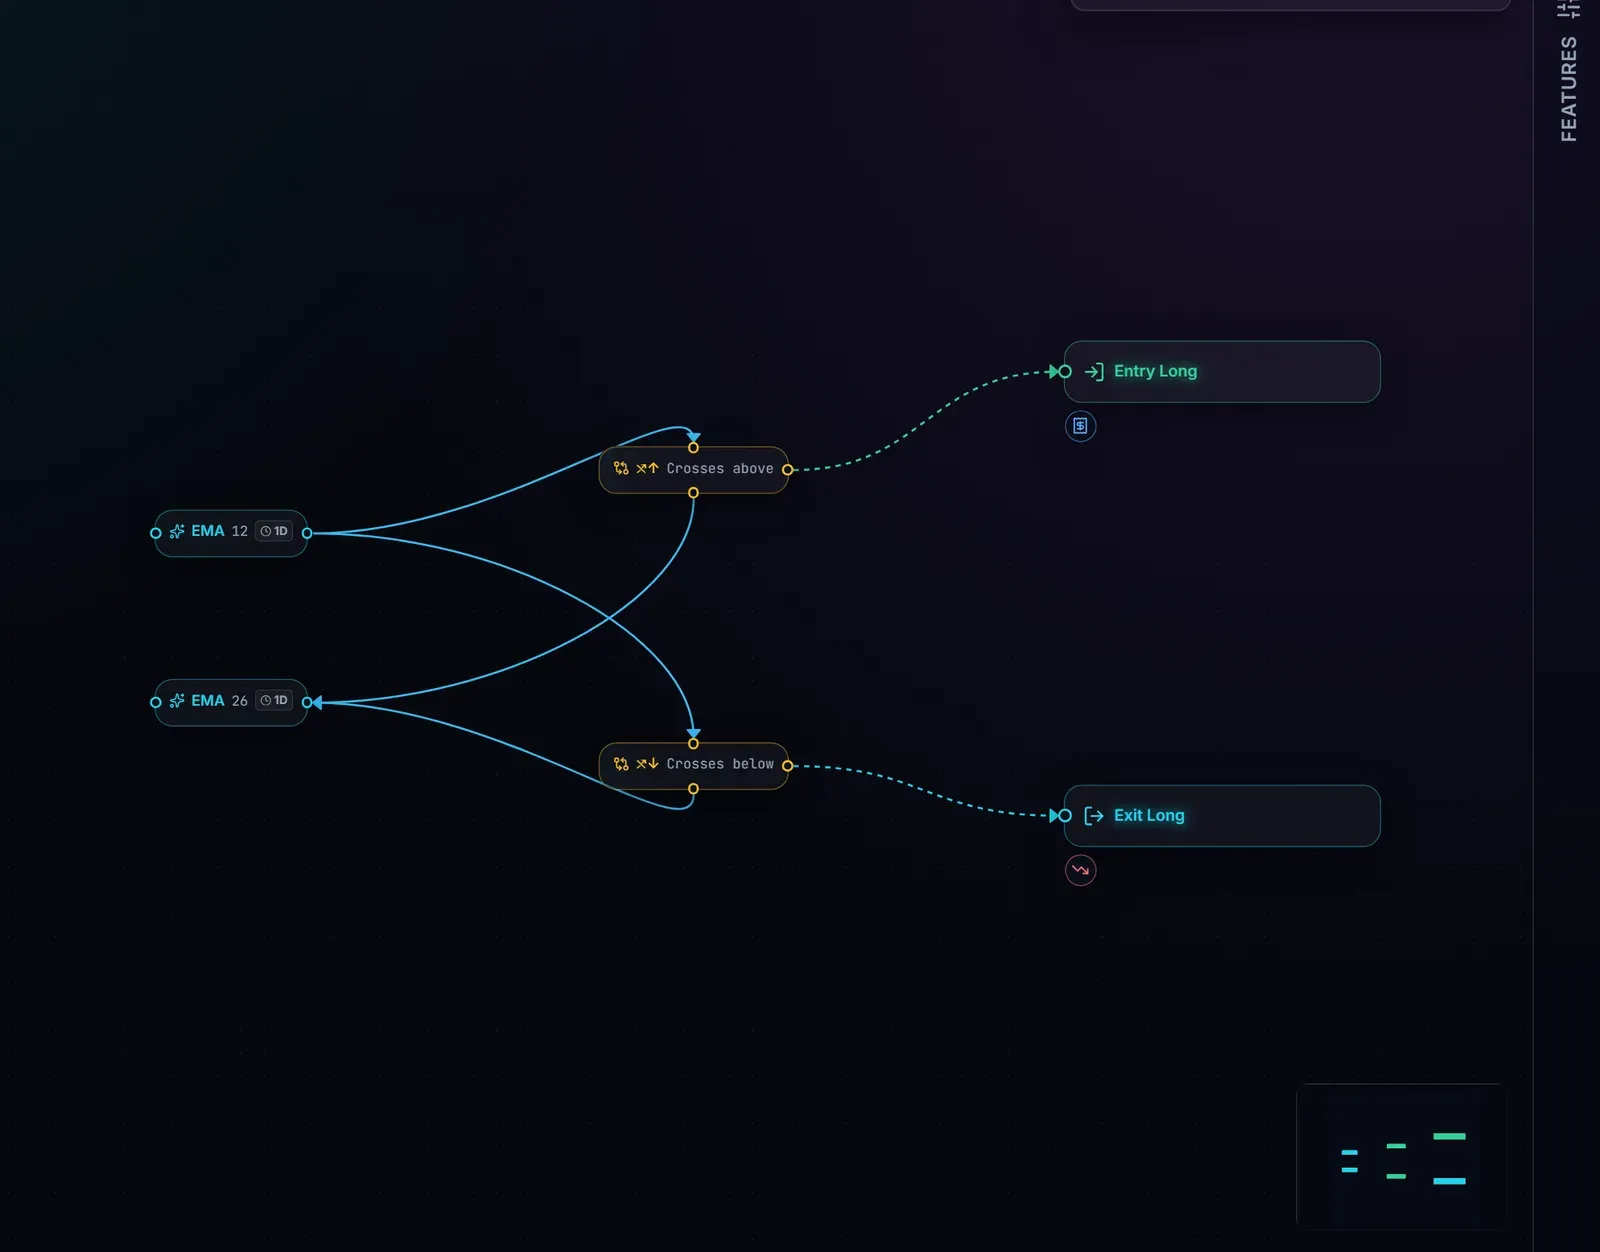
Hand-editable, and always in sync with the plain-English sentence it reads back as.
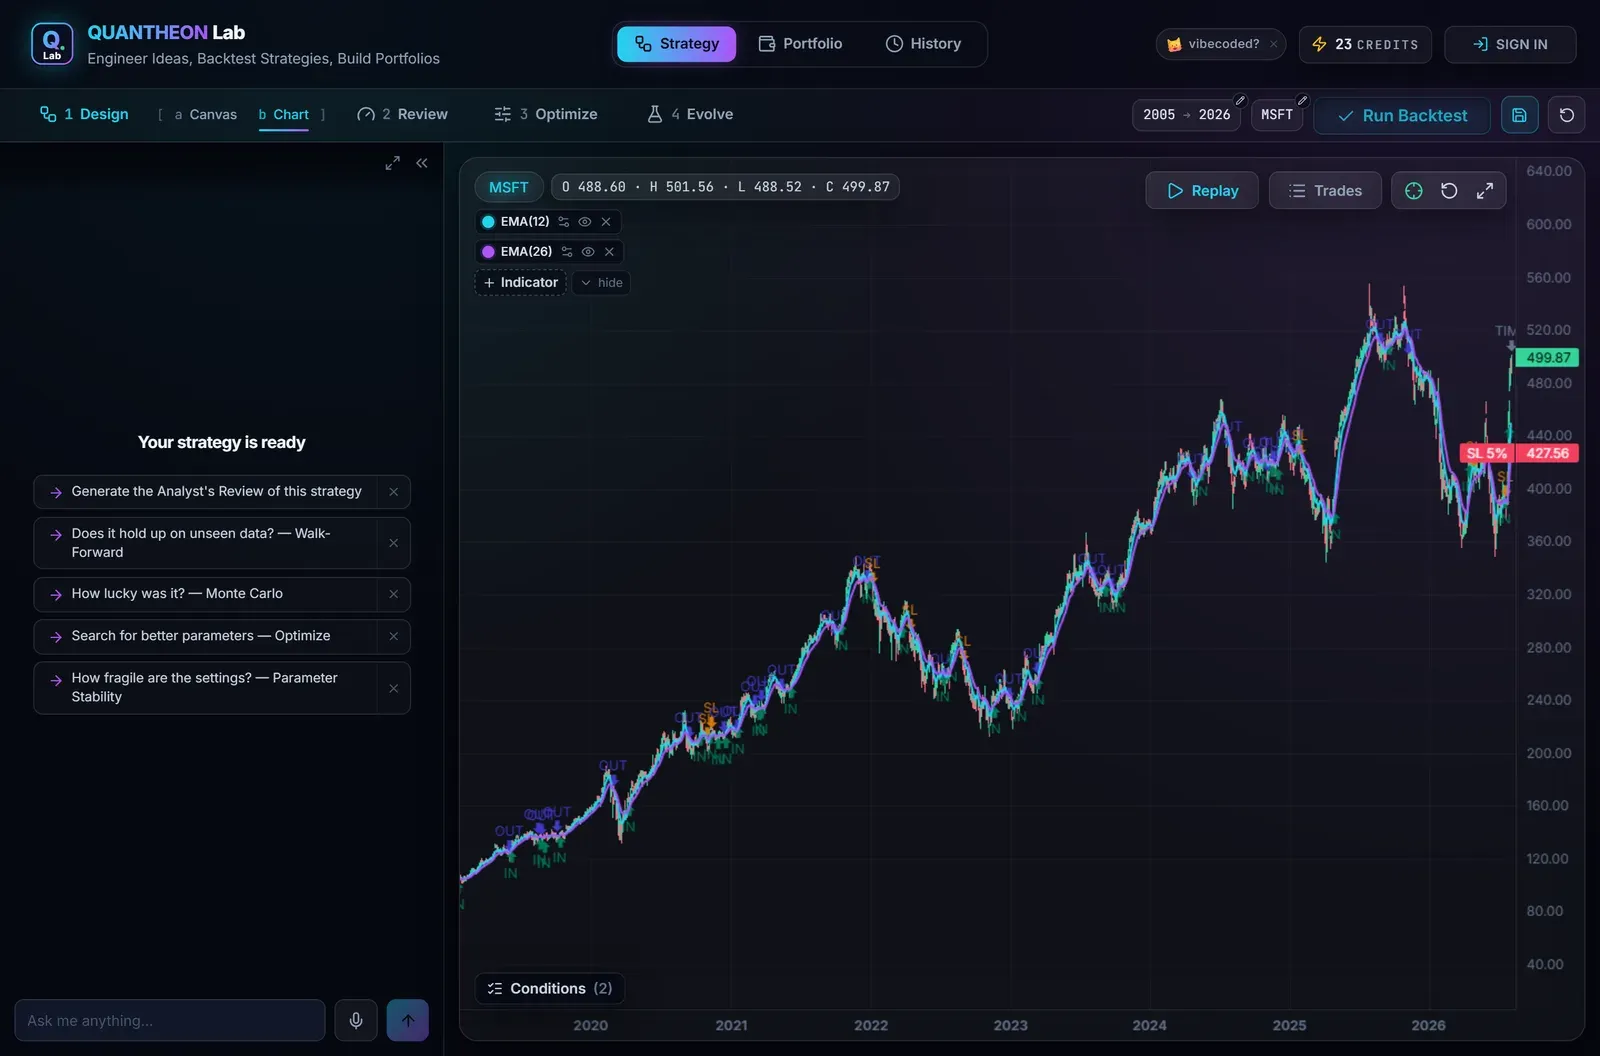
The line drawn here is the array the engine used — confirm it fires where you expect.
2 · Review
The equity curve against its benchmark, the headline metrics and the drawdown, net of the costs you set. Then the honesty layer, on the same page.
Read our example honestly, because it is the interesting case. Over twenty-one years the crossover turns into +431.6% — while simply holding the stock returned +1,805%. It gave up most of the ride to cut the worst loss to 34.4%, and the Strategy Score reads a modest 30/100: on a single name that trended for two decades, stepping out of the market is expensive. That is not a bug in the strategy or a flaw in the tool — it is the trade the rules make, stated in numbers instead of hidden behind a rising line.
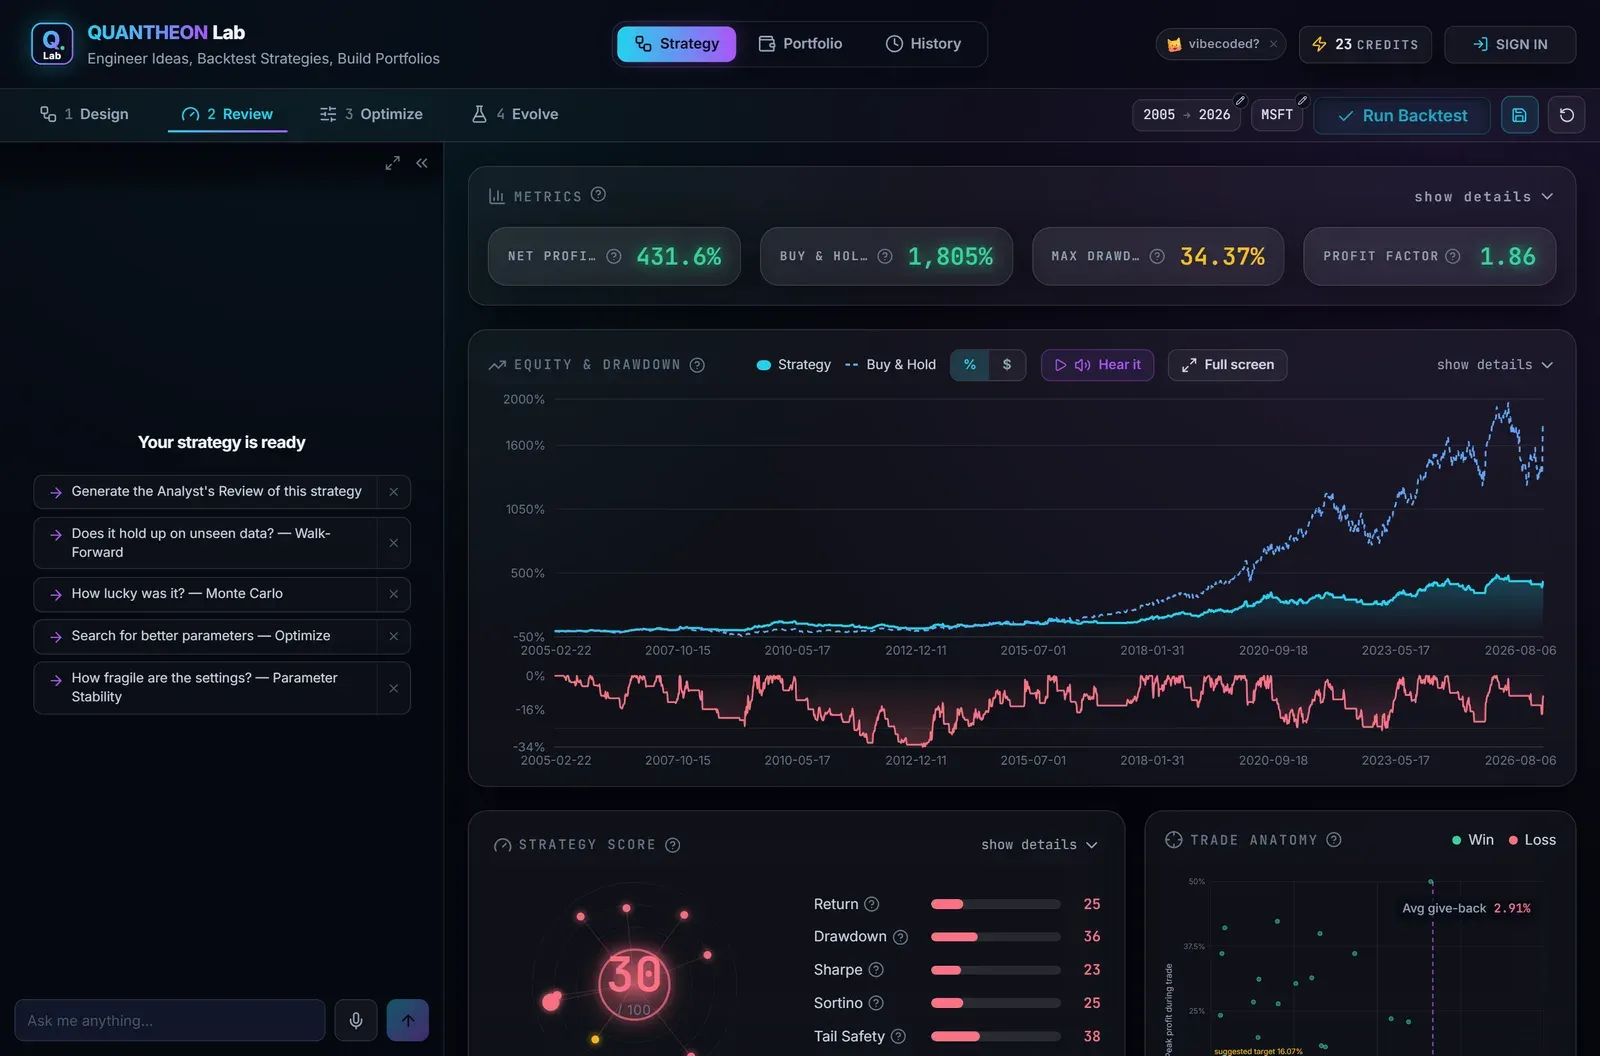
Always against the benchmark you have to beat — even when the benchmark wins.
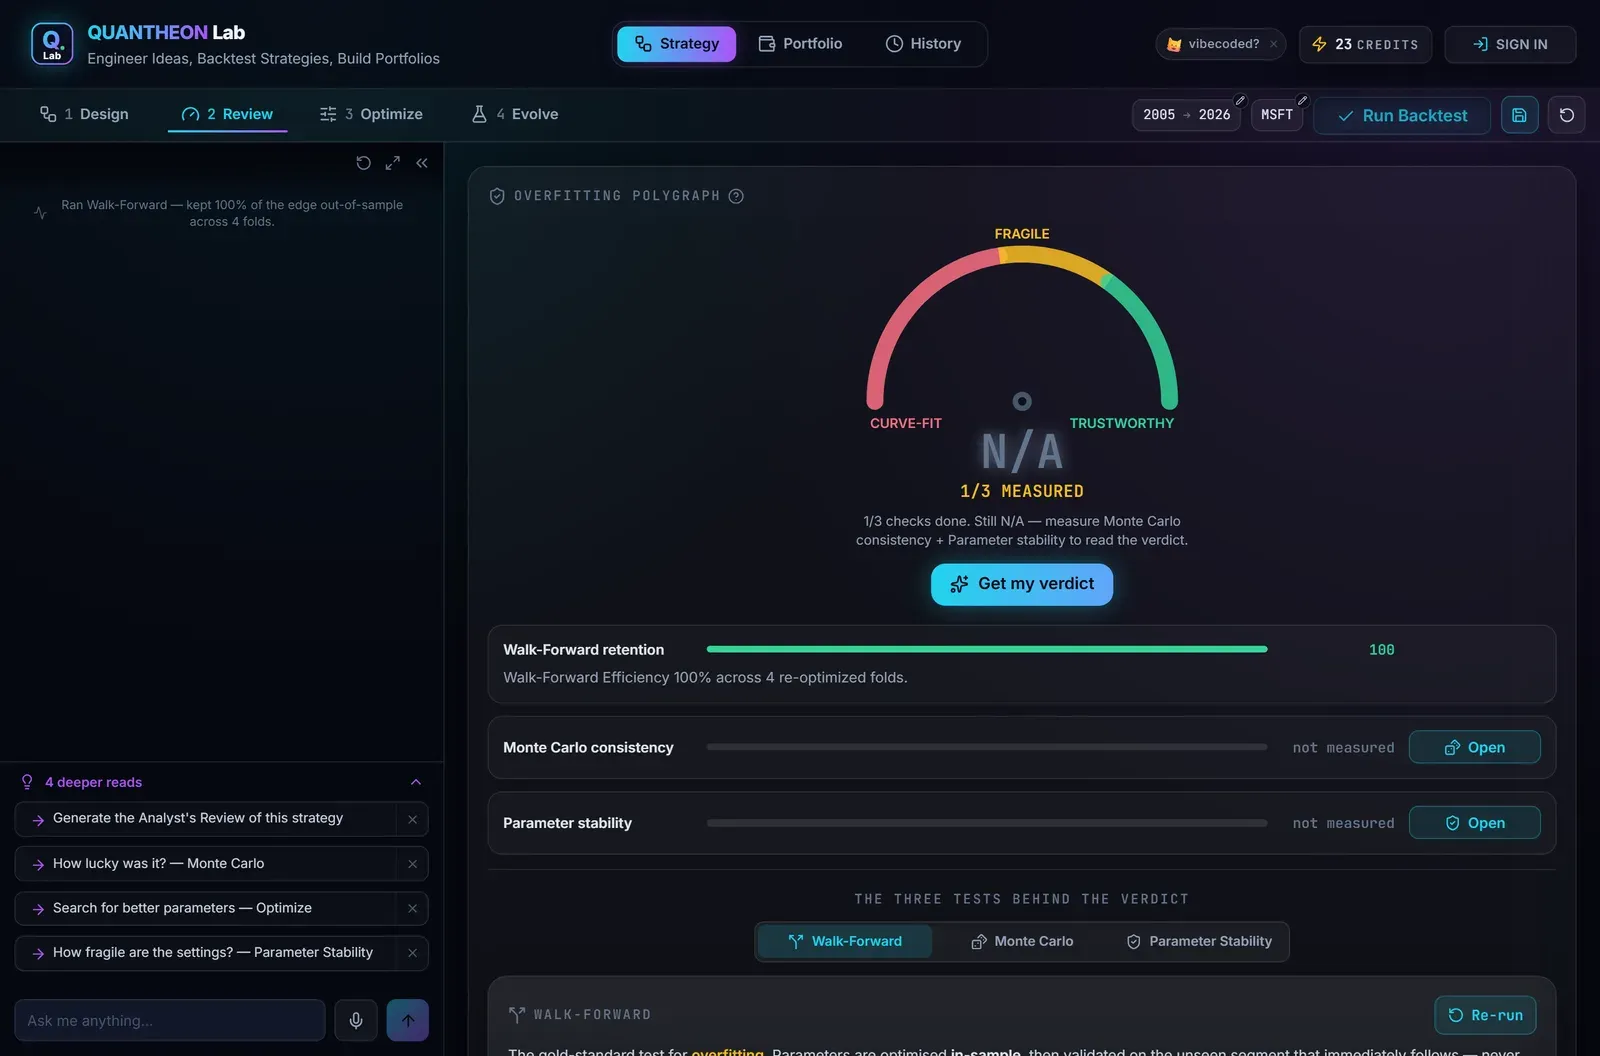
Walk-forward kept 100% of the edge across four re-optimized folds — and the verdict still reads N/A, because one check out of three is not a verdict.
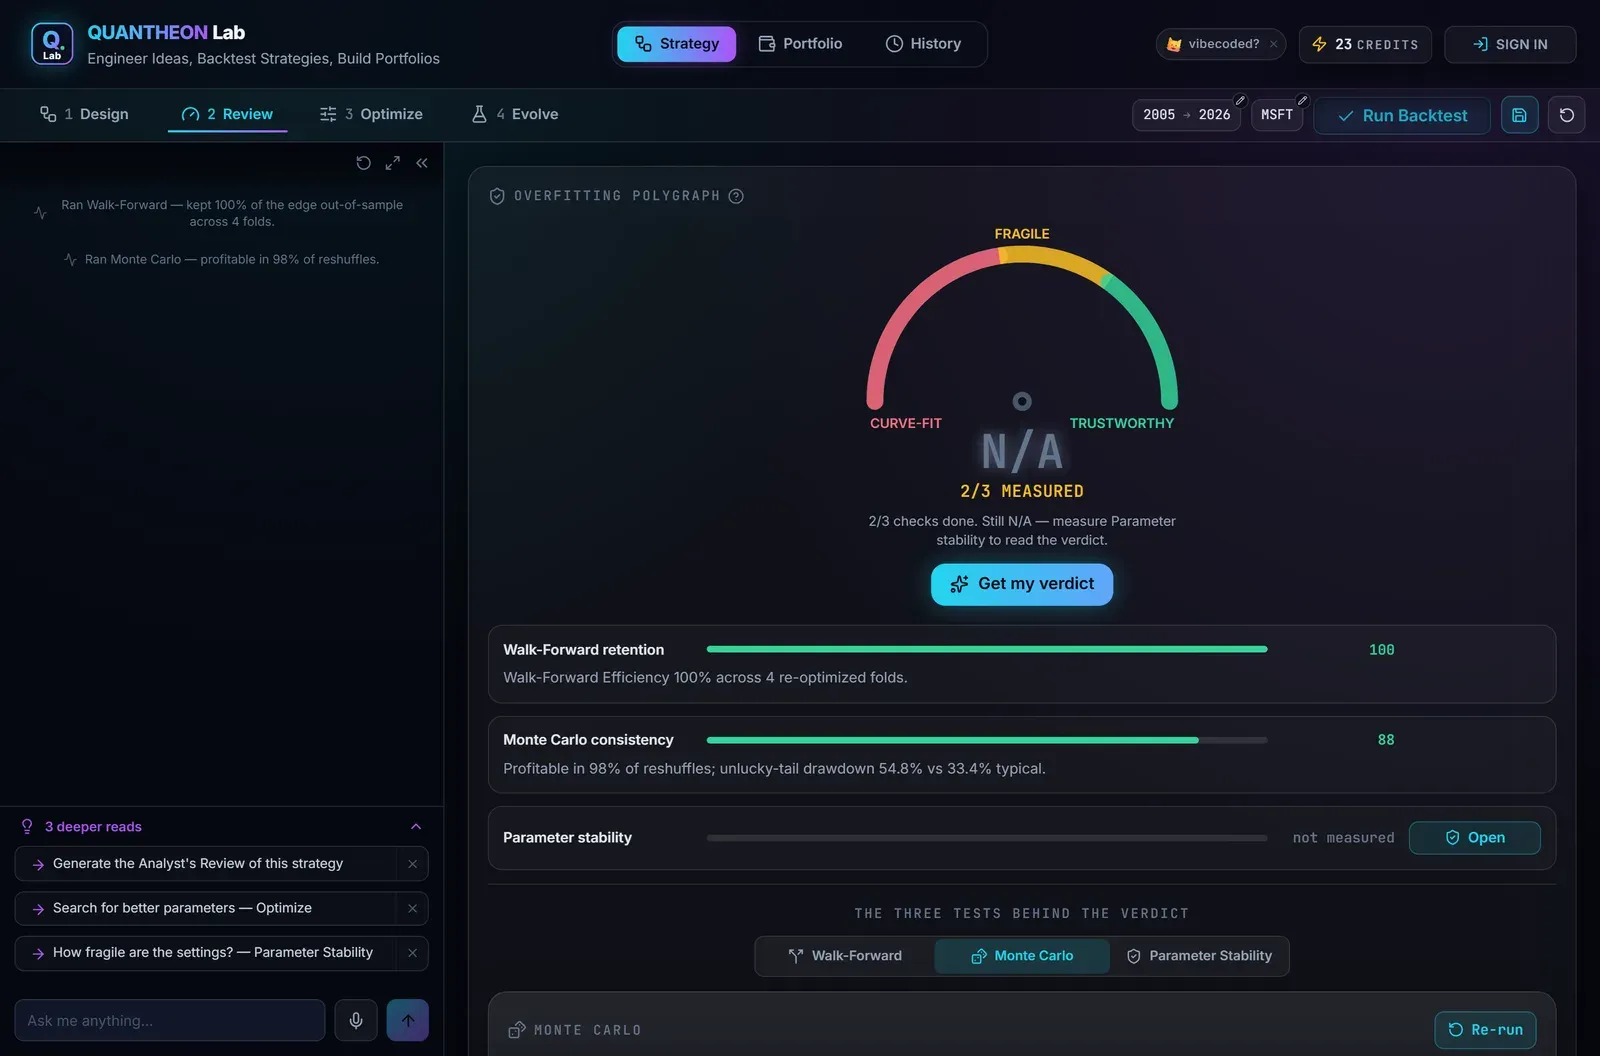
How much was skill, and how much was the order the trades happened to arrive in.
The rules, in questions
Do I need to code?
No. Describe the strategy to the desk in plain English, load a vetted preset, or wire the blocks by hand — the engine runs the same either way, and every rule reads back as a plain-English sentence you can check.
Can I edit what the AI builds?
Yes, all of it, as blocks on the Canvas. Every AI change is also an undoable receipt, so nothing it does is irreversible.
How do I know if it's overfit?
The Overfitting Polygraph at the bottom of Review combines walk-forward on unseen data, a Monte-Carlo resample and a parameter-stability sweep into one verdict — trustworthy, fragile or curve-fit — and shows the evidence for each. It stays N/A until all three have run: a partial score would be worse than none. More →
Should a good strategy always beat buy-and-hold?
No, and assuming so is a trap. A long-only strategy on a strong index often trails buy-and-hold on total return; its value is usually a smaller drawdown and a smoother ride. The benchmark is always drawn beside your result so you judge it honestly.
What does the Strategy Score actually measure?
Risk-adjusted return that keeps paying: profit, drawdown, consistency, tail behaviour and stability, on soft curves rather than pass/fail thresholds. Profit never stops earning points above the target — beating the index is the mandate, not a box to tick. The full breakdown →
Does optimizing parameters make the result better, or just prettier?
Usually prettier, unless it survives the hold-out. Optimize ranks by the full-window Score but keeps the out-of-sample half as a gate, so a winner that only works in-sample is shown as such rather than promoted. Walk-forward →
Are costs included?
Yes — commission and slippage are yours to set on each strategy and are applied to its own trades. If that strategy later becomes a portfolio sleeve, the book's own re-allocations are billed at those same rates rather than at some invented constant.
Can one strategy trade several instruments?
Yes. Add three or more and you get a per-asset breakdown plus an aggregate. Note that the optimizer then tunes one parameter set across all of them — tuning each symbol separately is just overfitting each one.
Can I read an indicator from N bars ago?
Yes — every operand carries a look-back offset, shown on the block and in the plain-English read-back, so “yesterday's close” is a setting rather than a workaround.
What can I do with a finished strategy?
Save it to History to watch its edge decay over time, add it to a Portfolio so it shares capital with other sleeves, or export the Python and run it elsewhere. Custom indicators you build are saved to your library and reused by name, never duplicated.
Can I bring a TradingView / Pine strategy in?
Yes — paste the Pine and it is translated into blocks, with anything unsupported flagged rather than silently dropped. Expect directional agreement with TradingView, not identical numbers: fills, data feed and default costs differ. How the import works →
Related: Portfolio Lab walkthrough · What is overfitting? · How to backtest a strategy · The Strategy Score · Pine Script → no-code