Build and backtest a portfolio in QUANTHEON Lab: a full walkthrough
One strategy is a bet; a portfolio is a plan. Three phases, real screenshots of the live app, and every rule the engine actually follows — laid out as answers, not essays.
The map
- 1 · Build — what's in the book, how much of each, the capital, the period, the rebalance cadence, an optional monthly plan.
- 2 · Review — the blend against its benchmark, per-asset attribution, how full the account was over time, the last trades your strategies closed, and which allocation rule survives.
- 3 · Optimize — search the weight space, then promote the winner back into Build.
- The desk, on the left throughout: describe a book in plain English, or take one of its computed next moves.
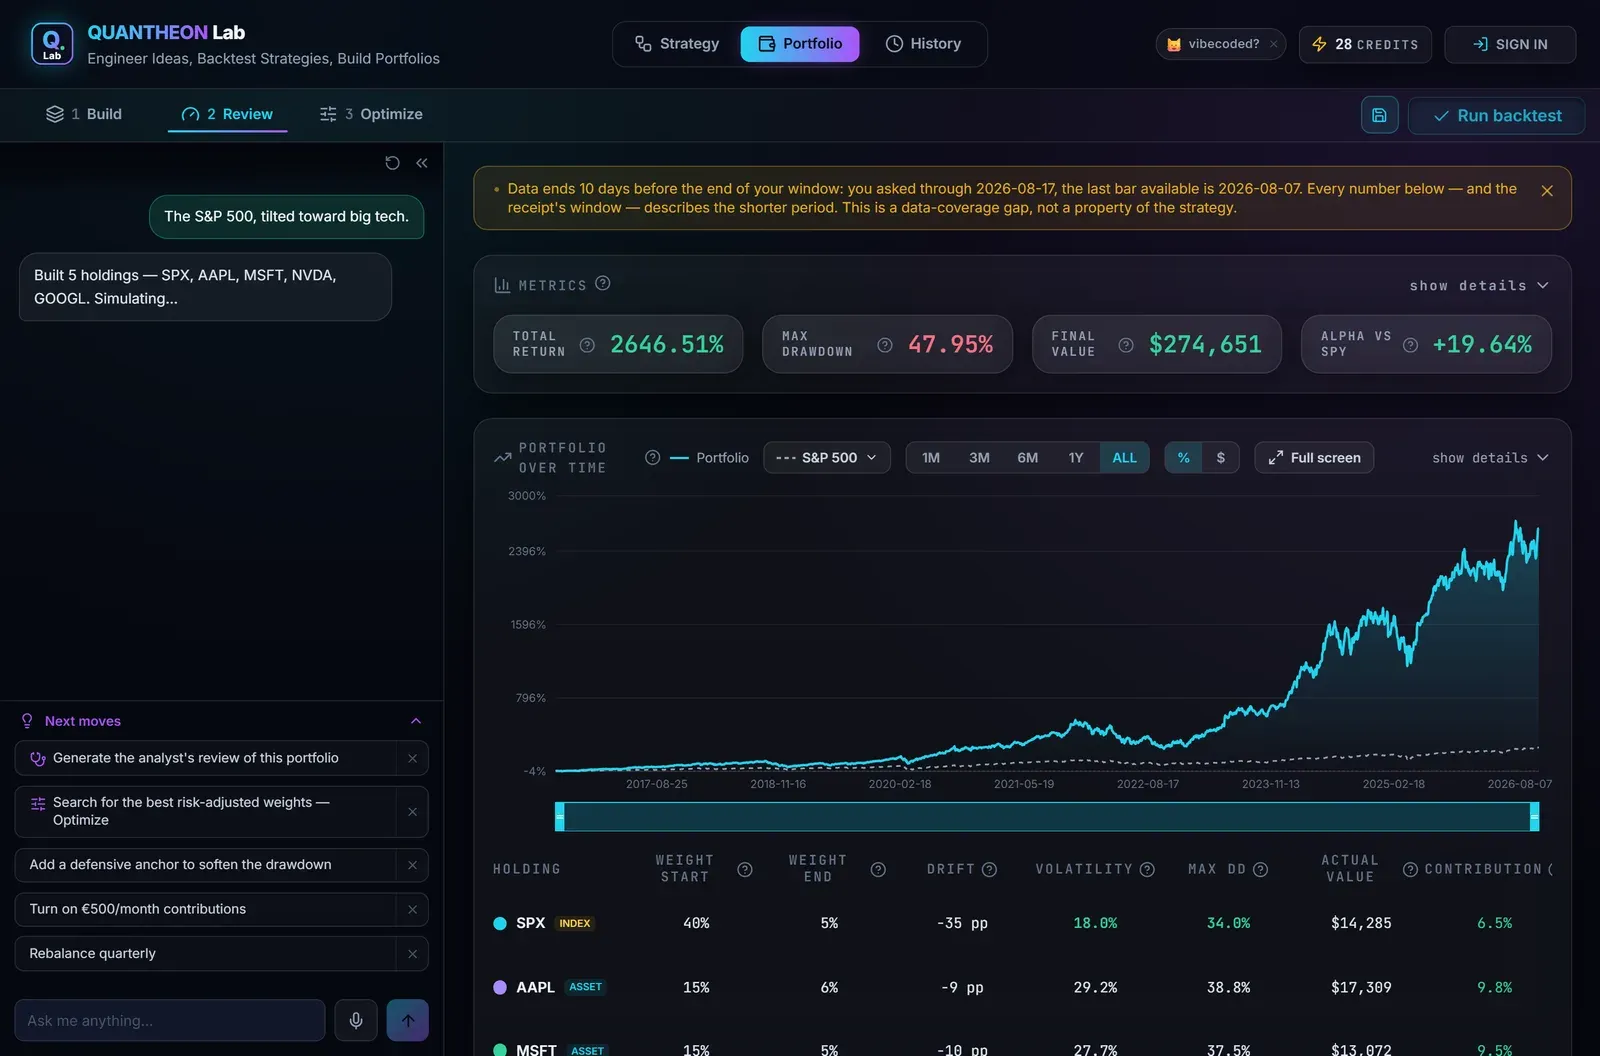
A research desk on the left, a live book on the right.
1 · Build
Pick a one-click starter or type it the way you'd say it (“60% AAPL, 40% MSFT, invest 10k, rebalance quarterly”). Then edit anything by hand: stocks, ETFs, indices — and your own saved strategies — side by side.
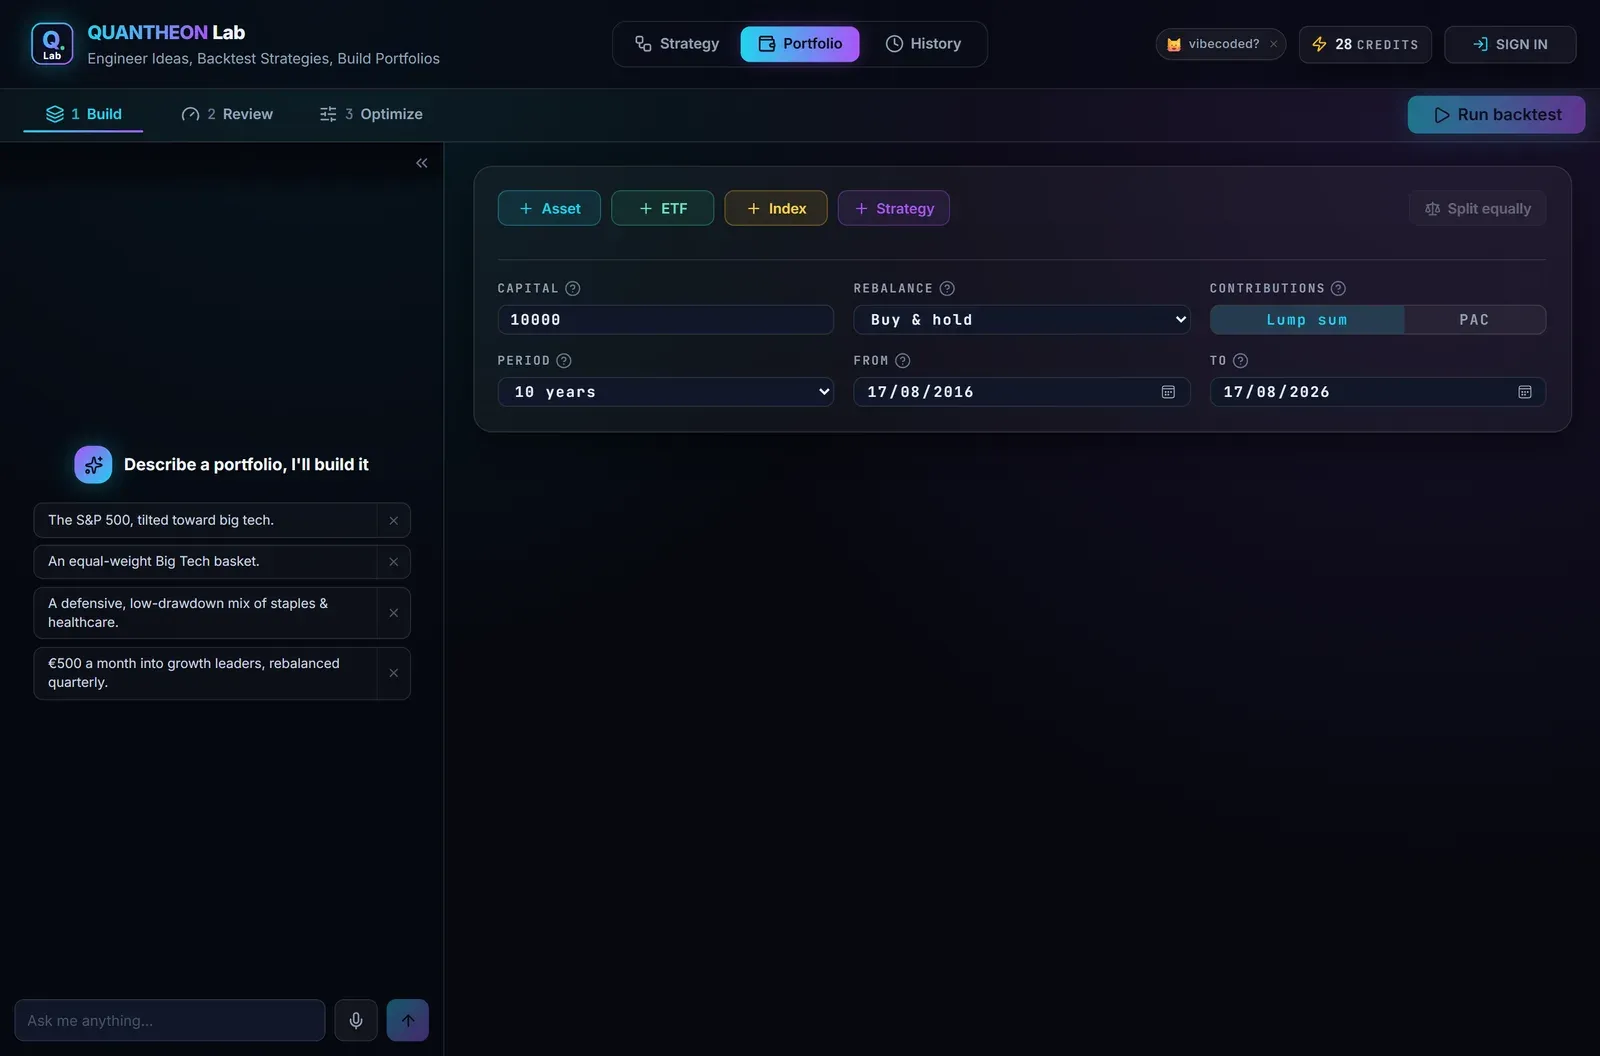
Four starters, or plain English — a real book in seconds.
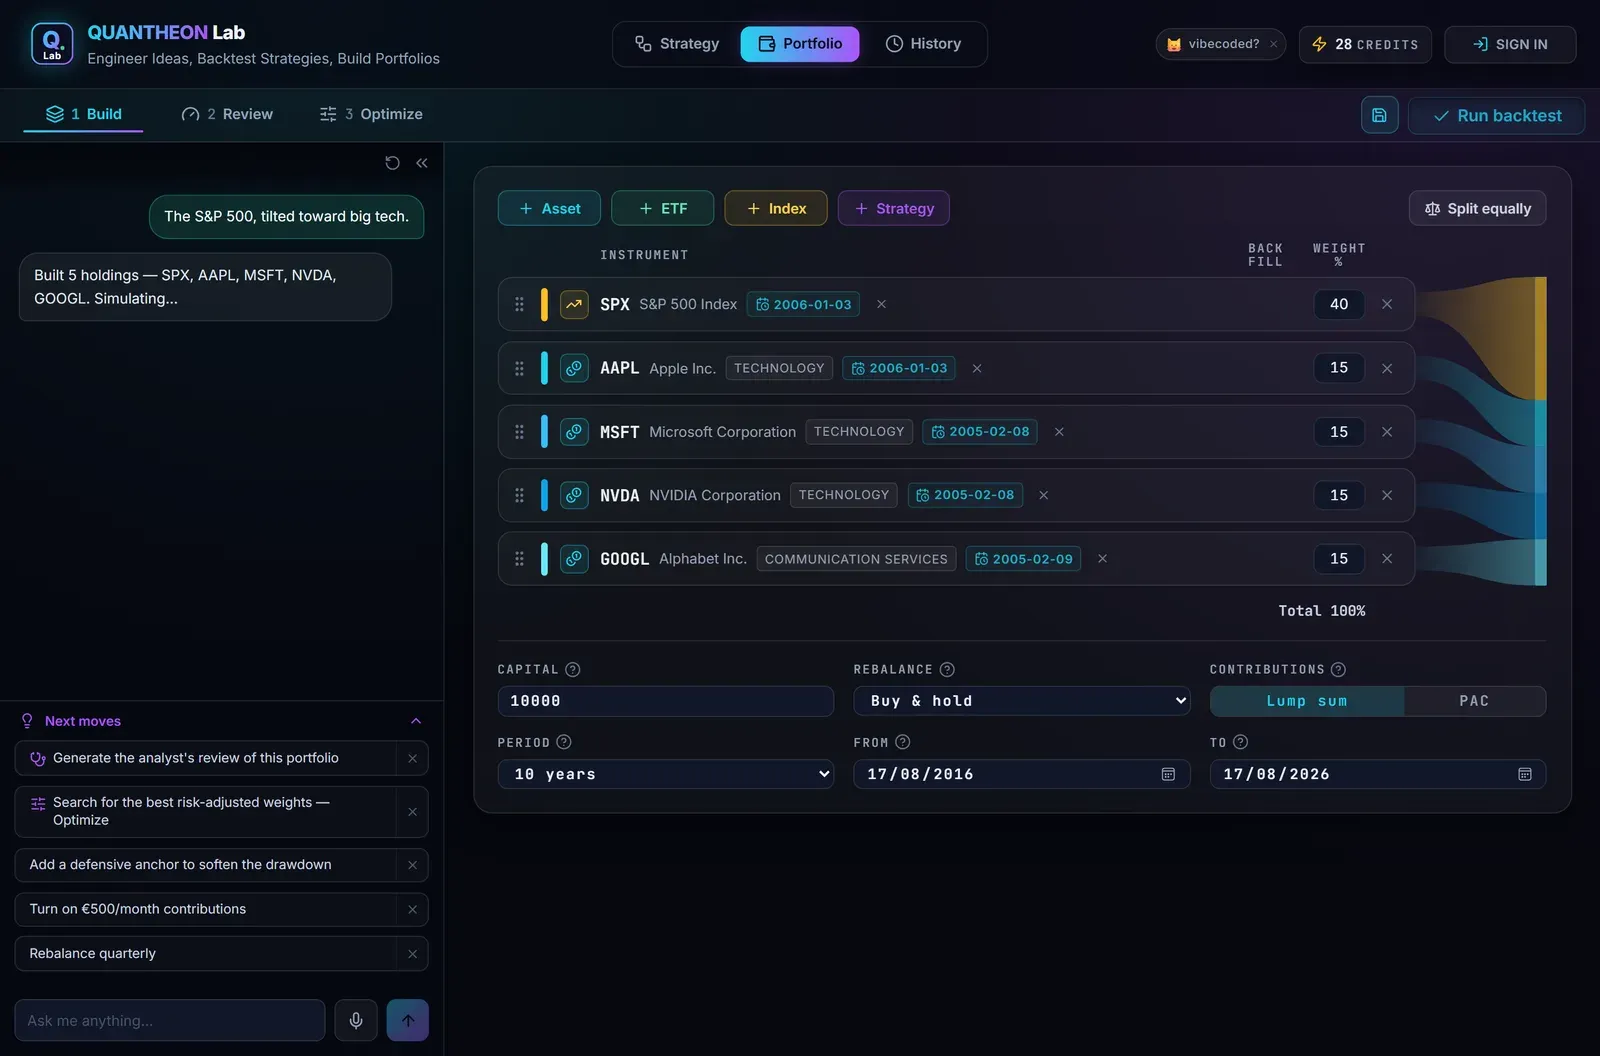
Each row's weight carries on to the right as a ribbon — the book is the diagram.
2 · Review
One run gives the blend against its benchmark, the headline metrics, per-asset attribution, the last ten trades your strategy sleeves closed, the deployed capital over time, and the allocation verification at the bottom.
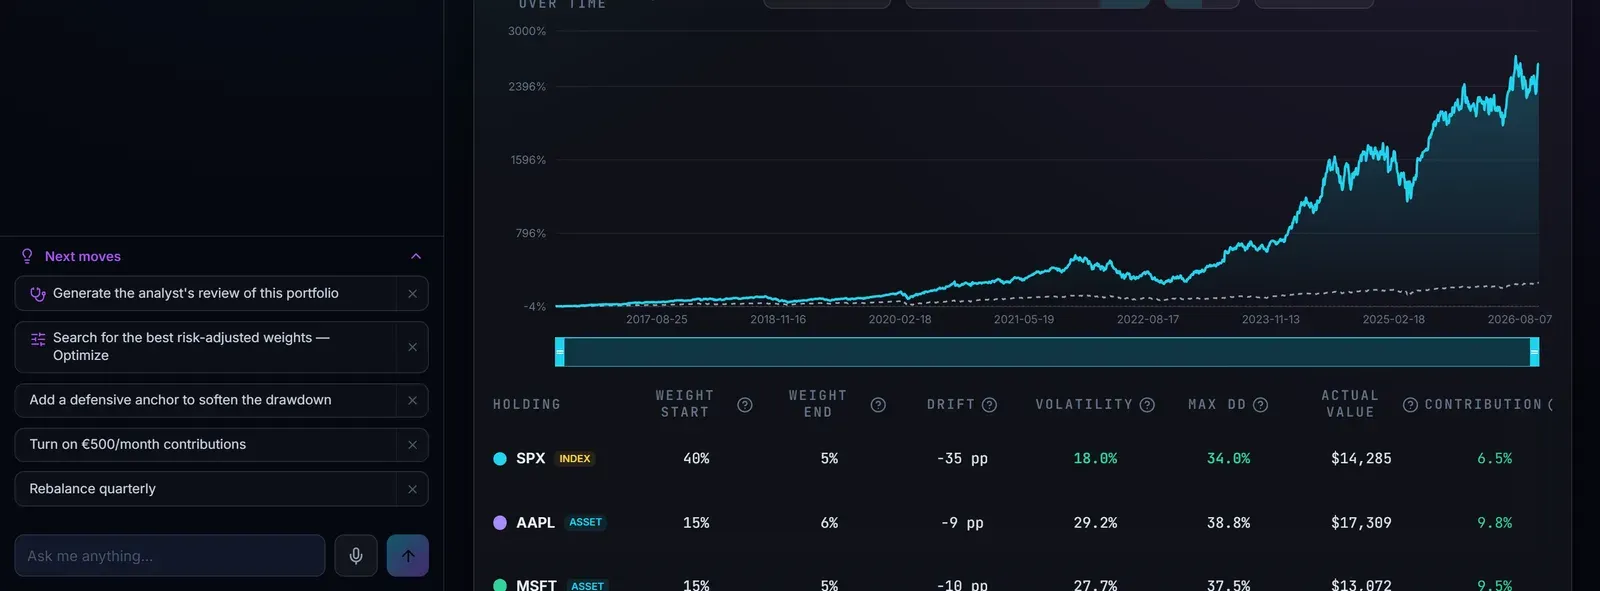
A big number always comes with its drawdown.
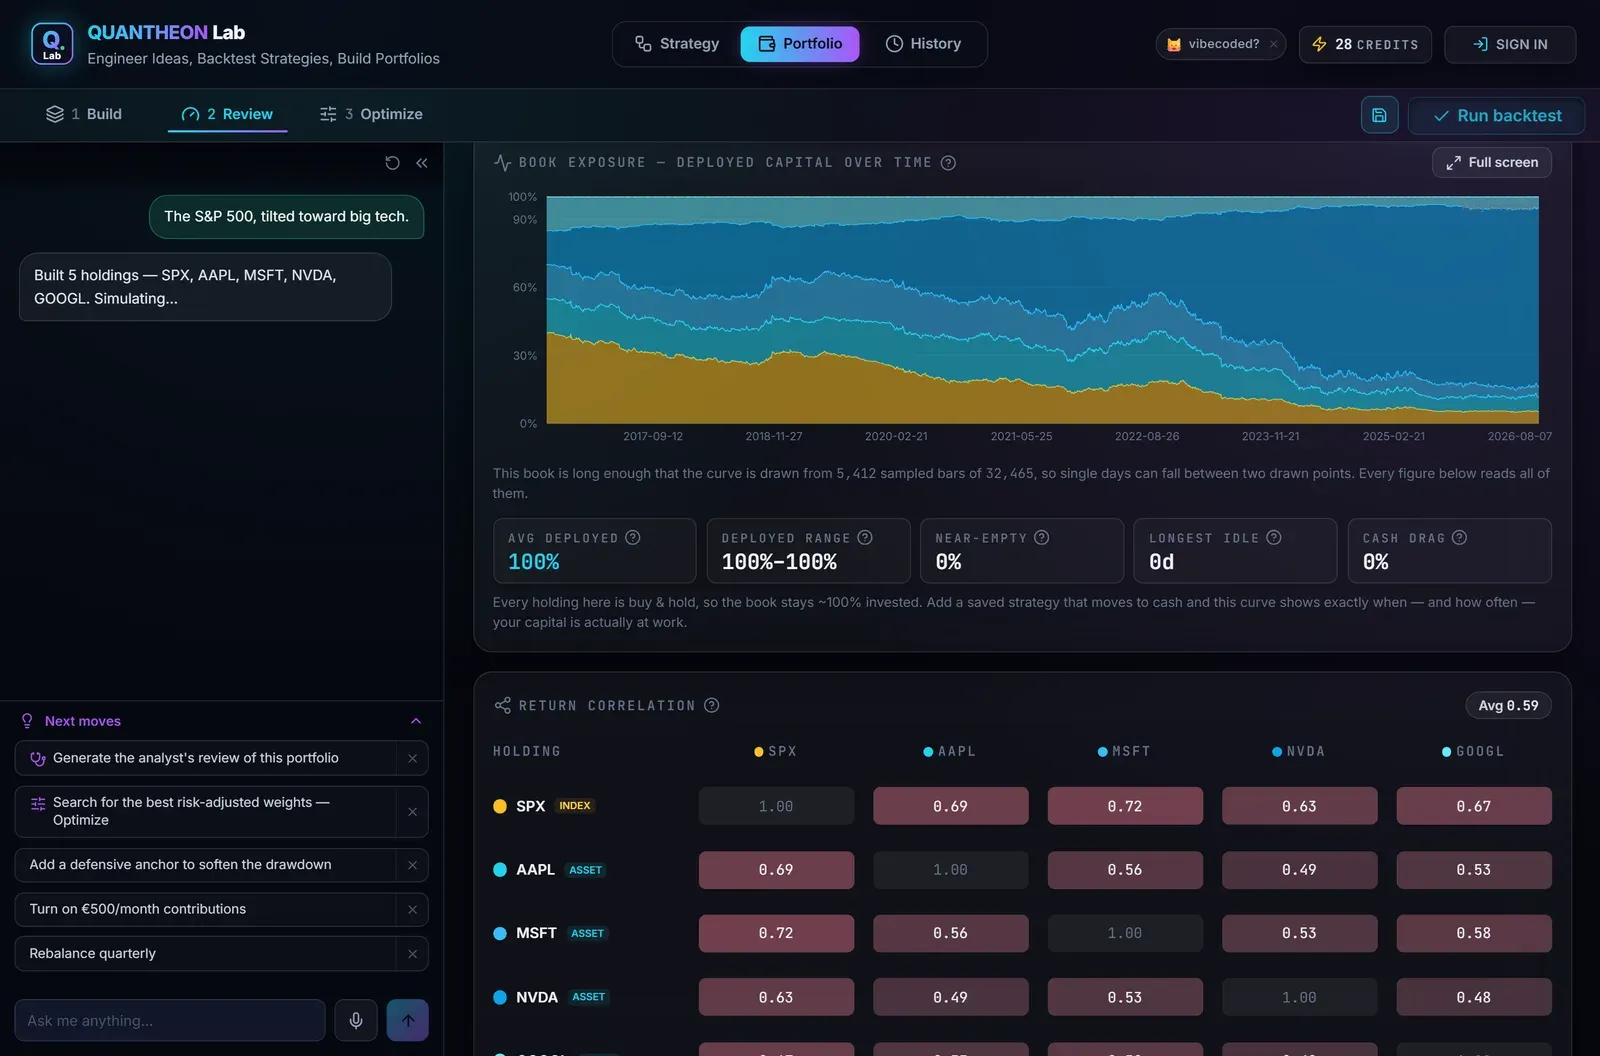
When the capital was actually at work — and how correlated the holdings really are.
3 · Optimize
Pick the objective and the depth, and the sweep plots every candidate on a risk/return frontier. The promoted winner is scored against your current mix, never in isolation.
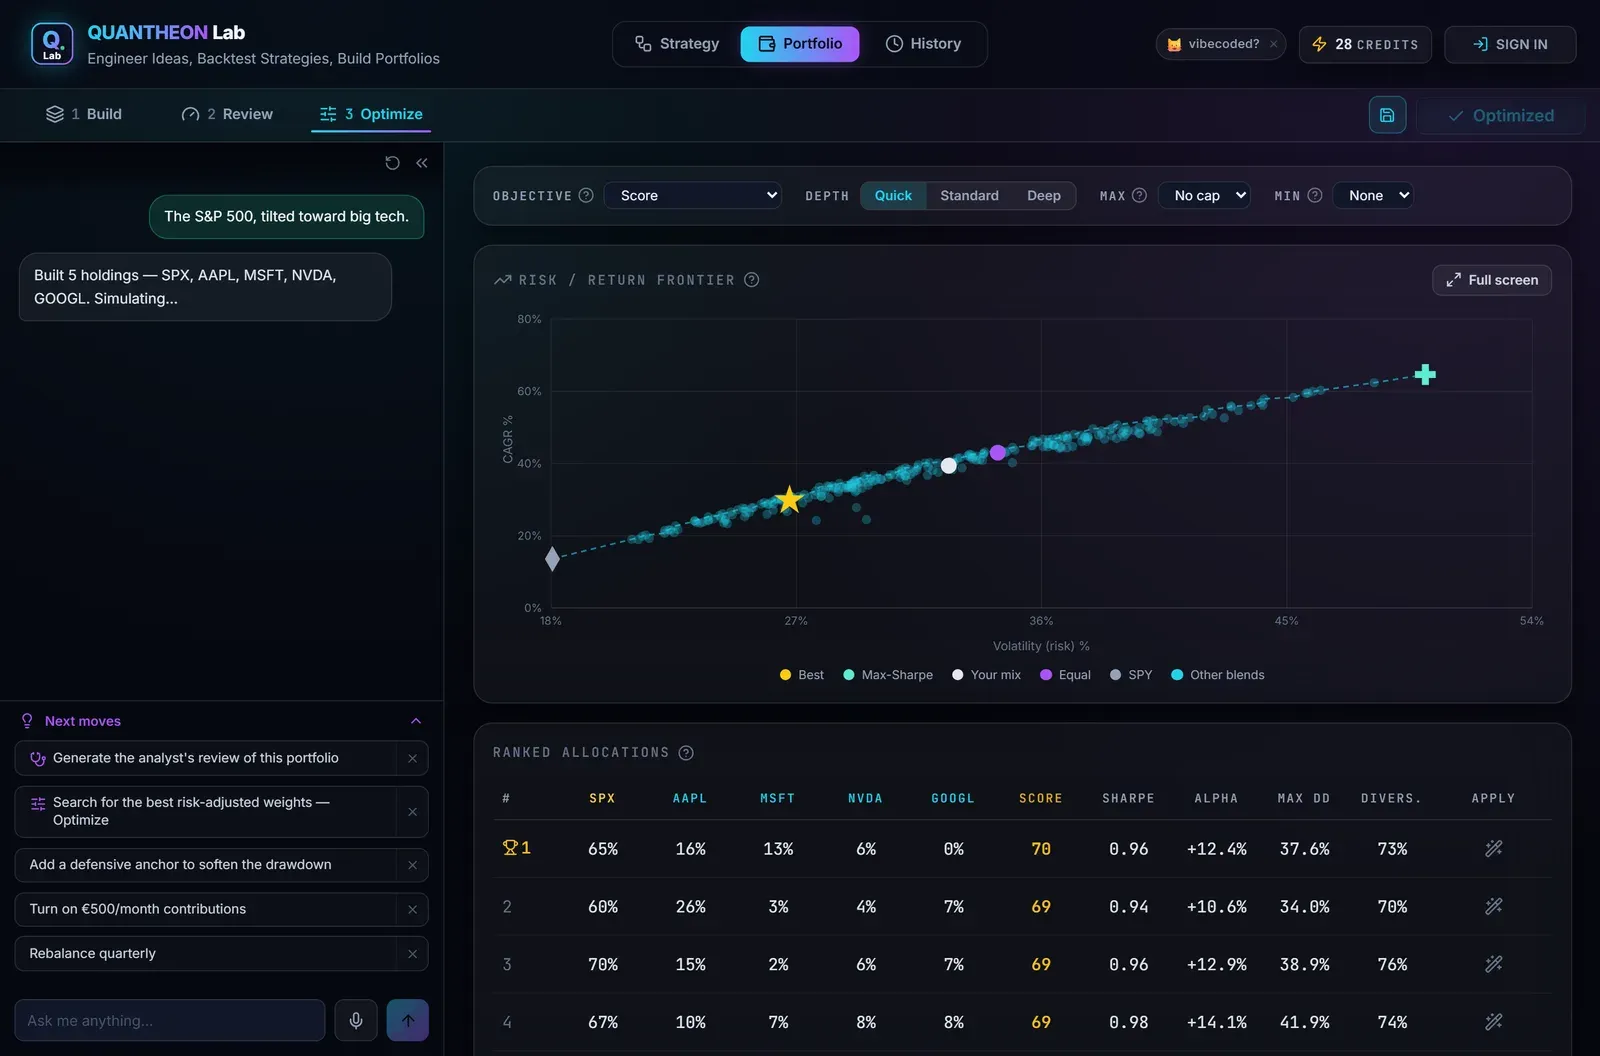
Every allocation tried, ranked — and the honest comparison is against your own mix.
The rules, in questions
Is this five backtests glued together?
No. Every holding runs on one shared account. When a strategy sleeve steps to cash, that capital is offered to the holdings that are trading; when it re-enters, it takes its share back. A plain blend can't represent either. The shared-capital explainer →
When does the book actually trade?
Three moments, and nothing else moves a cent: (1) a sleeve's own position changes (it enters, exits, scales, takes a partial profit); (2) a holding's history begins or ends inside your window; (3) the scheduled rebalance. Even then it only trades if what a sleeve is funded with differs from what its target calls for by enough to be worth it.
What exactly does the quarterly rebalance do?
On the first bar of each quarter it re-cuts straight back to your target weights — immediately, waiting for no signal and asking no strategy's permission. It never closes anyone's trade: it resizes the stake behind a position, not the decision to hold it.
Why did my rebalance move almost nothing?
Because capital is re-cut every time it changes hands, drift rarely gets the chance to build up between quarters. That's the setting working, not failing — and the app measures it rather than assuming: it tells you on how many of its dates the cadence actually moved money.
What is Max % on a holding?
The ceiling on how much of the account that holding may take when the others sit in cash and lend theirs — the answer to “if everything else is closed, does this one end up running the whole book?”. It appears once a strategy is in the book, because a book of always-invested holdings can never exceed its own weights.
Is Max % enforced on every bar?
No, deliberately. It's brought back inside at the next re-allocation, not bar by bar — enforcing it continuously would mean re-cutting the book almost every day, and paying the trading cost for it, to defend a limit by a fraction of a percent. A winner can therefore sit above its ceiling in between, and the run says so: each holding reports the peak share it actually reached, and a peak above its cap raises a warning.
What's the difference between Max % and the Optimize panel's “Max / holding”?
Two different things. Max % (on the holding row) constrains the book and is always applied. Max / holding (in Optimize) constrains the search — which weight vectors get tried — and never reaches the engine.
Should I let a rule allocate the capital instead of my own weights?
Maybe not, and Review will tell you. The “Which allocation policy survives?” panel runs equal-weight, risk-parity and min-variance beside your own weights on the same window, net of trading cost, judged against the 1/N baseline and re-checked out-of-sample. On most books the honest verdict is “nothing beats equal weight beyond the noise” — and that is the answer, not a failure to find one.
Why can't I optimize weights while a rule is allocating?
Because the rule recomputes the weights at every rebalance, so anything the sweep found would be overwritten before the first bar. Optimize says so and offers you the comparison, or a return to your own weights.
Can I add a monthly contribution plan (PAC)?
Yes, and it's modelled inside the simulation. A deposit is not a rebalance: new money is placed across the sleeves that can take it, in proportion, leaving every existing position where it was.
Can the book use leverage?
No. The shares are a partition of the account's own value, so deployed capital can never exceed 100% — there is no setting that asks to borrow.
Why does the exposure chart start after the first date I asked for?
A book of strategies opens in cash and waits for its first entry signal. That wait is reported as its own Lead-in tile in days, and the curve begins where the book actually deploys — so every statistic beside it is measurable on what you can see.
Will optimizing the weights overfit?
It can — searching allocations is still a search. Force diversification with the min/max box, keep the depth shallow, and judge the winner against your current mix rather than chasing the best in-sample number. More on overfitting →
Can I hold my own strategies in a portfolio?
Yes. A saved strategy can sit beside stocks, ETFs and indices — and if it trades instruments the book already holds, it doesn't double-count them: each of those instruments keeps its own weight and the strategy simply decides when it is held.